OpenAI in LynxKite
LynxKite strives to make graph analytics easy, fast, and accessible. You can import your data, compute a dozen metrics, visualize your graph, and train machine learning models with a few mouse clicks. But when you have questions that can’t be expressed with clicks, the only option has been to write SQL or Python.
LynxKite 5.3.0, released today, changes this with the addition of the OpenAI box. This box is easy to explain. It uses OpenAI language models to turn a natural language query into Python and runs that Python code on your graph.
LynxKite is not affiliated with OpenAI. This feature is built on the publicly accessible OpenAI APIs. The OpenAI logo is only used to indicate the provider of the language model.
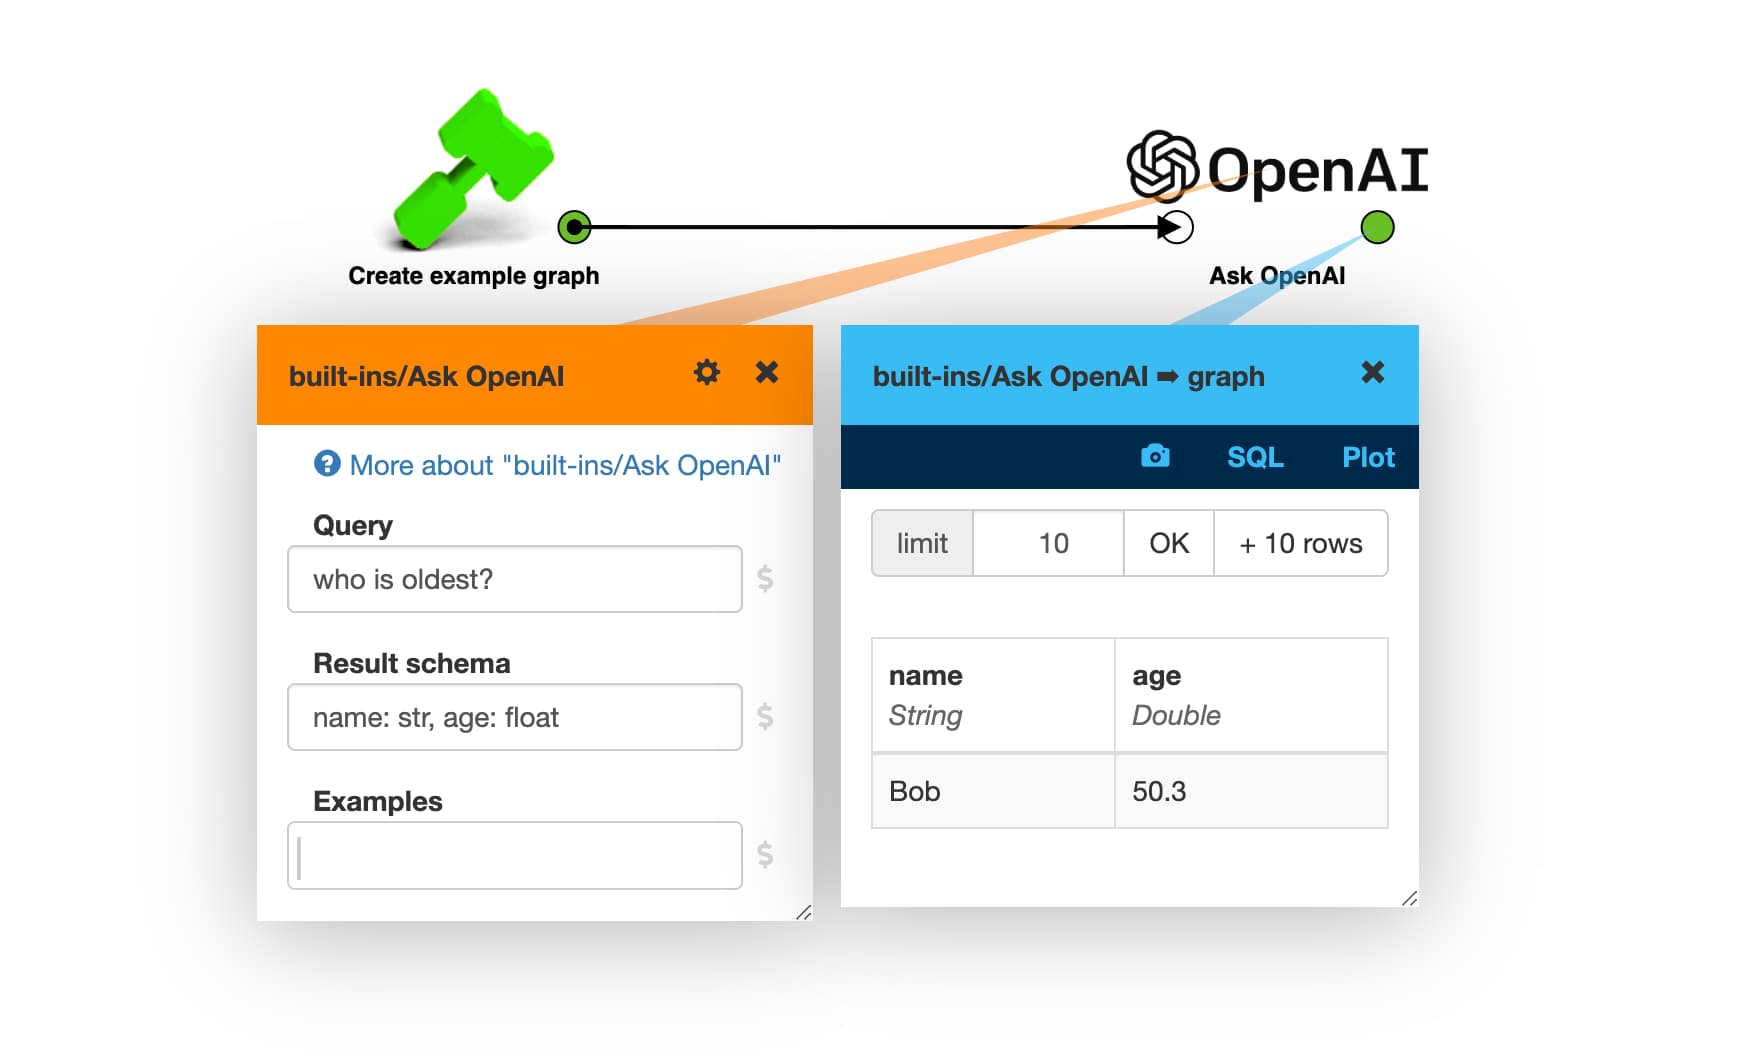
Same as the Python box, you specify what you want and what columns it ought to have. But instead of Python, you can use English or another language. (The Examples parameter can be used to “teach” the model how to work with your specific data. It’s okay to leave it empty.)
Behind the scenes, OpenAI generated the following code:
return nodes.nlargest(1, 'age')[['name', 'age']]
It’s trivial code for a Pandas user. But “who is oldest?” is still quicker to type. Natural languages are amazingly compact. I can just say “the closest female friends for each man” and OpenAI generates 20+ lines of complex code.
And not everyone is a Pandas user. LynxKite wizards were designed to give non-technical users interactive access to a workflow built by data scientists. Until now, wizards either had to compromise on ease of use (letting the user type SQL) or on flexibility (not letting the user type SQL). With the OpenAI box, wizards can be as flexible as a data scientist writing Python code, and as easy to use as sending a chat message to said data scientist.
We’ve added the Airlines demo with OpenAI wizard on try.lynxkite.com to show how powerful this can be. This wizard lets the user ask questions about a dataset of airlines.
It can answer queries like:
- “show me the American airports”
- “the coldest 10 cities”
- “airports in the same timezone as Paris”
- “airports connected to SFO with flights shorter than 1000 miles”
- “which airports are most important in a pandemic?”
- “aeropuertos de tr+ínsito entre MVD y JFK”
The wizard is set to visualize the selected airports in the second step. Here’s the visualization for the last example:
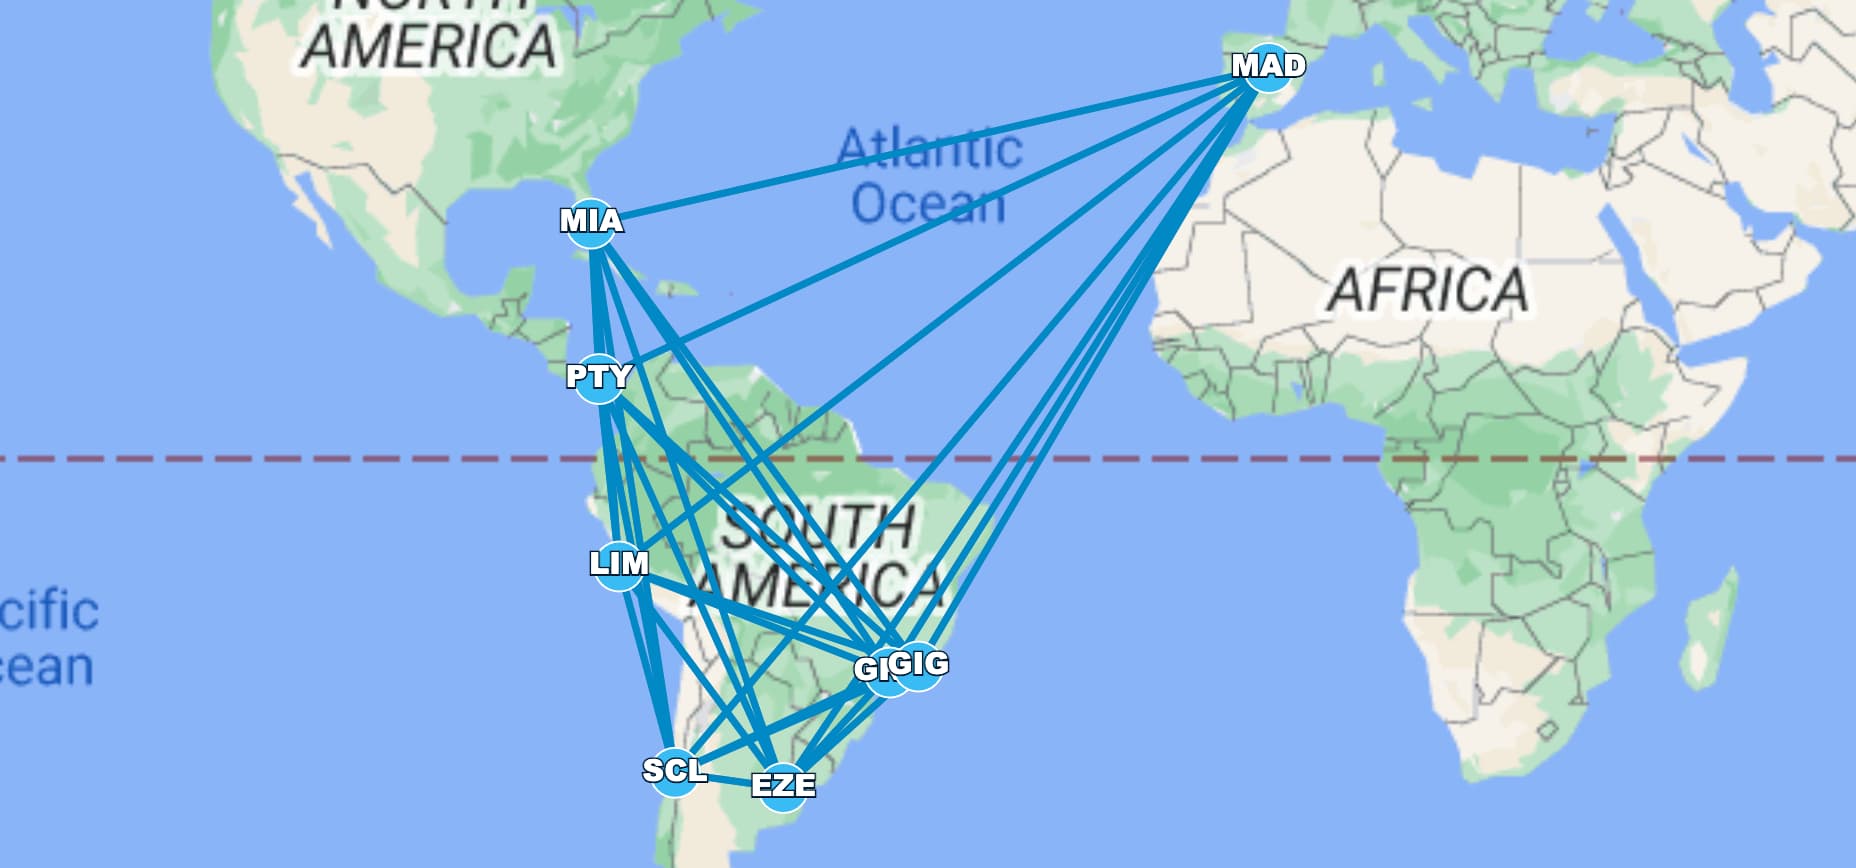
Try the wizard for yourself if you want to get a sense of its power.
We like to give the impression that the AI can answer any question, but it’s of course limited by the available data. To see what attributes are available in the graph take a look at the raw data in the workspace. It can’t answer some of the pressing questions:
Which city has the best pizza?
Unfortunately, the given data does not contain any information about the quality of pizza in different cities. Therefore, it is not possible to answer this question using the given data.
I'm getting an exception: Could not find the Python code in "Unfortunately, the given data does not contain any information about the quality of pizza in different cities. Therefore, it is not possible to answer this question using the given data."
I apologize for the confusion. I was trying to convey that it is not possible to answer the question of which city has the best pizza using the given data. Here is the function that returns an empty DataFrame to indicate that the given data does not contain the required information: ```python def compute_from_graph(nodes, edges): """which city has the best pizza?""" return pd.DataFrame() ```
Make sure the result has these columns: airport: str
Here is the updated function that returns an empty DataFrame with the required columns: ```python def compute_from_graph(nodes, edges): """which city has the best pizza?""" return pd.DataFrame(columns=['airport']) ```
(This is a conversation that happens behind the scenes between LynxKite in orange and ChatGPT in blue.)
What’s next?
We see the convergence of two ideas. One is to be able to query existing datasets as easily as possible. The feature introduced above is a step forward in this direction. The other idea is to ground chat systems in facts.
A chat is an amazingly effective way to work on a problem, and for the first time we can do it with a computer. We can get a result, then discuss it, and refine it. Even better if the model covers multiple modalities, so we can discuss an image, a document, a table, a single record, or a whole graph.
But we can’t use this seriously until we can trust the model not to make stuff up. The box we’re releasing today illustrates how graphs help with this. The model may misunderstand something about your question, but it cannot make up new airports. You can be 100% sure that Bob is the oldest person in the first example, because the Python code is executed without further involvement from the model.
We believe that multi-modal chat systems grounded in large graph datasets are where these two ideas meet. And LynxKite will be there.