Introduction to the LynxKite Python API
Download this Jupyter Notebook Try LynxKite (This notebook is ready to run on our cloud demo.)
Table of contents
- Getting a LynxKite connection
- Creating boxes
- Working with graphs and tables
- Import
- Export
- Snapshots
- Forcing computation
- Using SQL on graphs and tables
- Parametric box parameters
- Saving a workspace
- Running a workspace
- Custom boxes
- External computation
LynxKite comes with a full Python API. The UI and the Python API provide the same features and you can easily switch between the two. A workspace created in Python can be inspected and further edited on the UI. Or you can generate Python code from a workspace in the UI with the click of a button.
Getting a LynxKite connection
The Python API relies on a running LynxKite instance. A connection to this instance is your starting point for all functionality.
If you are using a pre-configured environment, like demo.lynxkite.com, it’s very easy to get a connection:
import lynx.kite
lk = lynx.kite.LynxKite()
If you are building your own LynxKite setup, you will have to install the Python package:
pip install lynxkite-client
(Requires Python 3.6 or newer.)
You can then connect to LynxKite by specifying its address:\n”,
import lynx.kite
lk = lynx.kite.LynxKite(address='http://localhost:2200/')
Once you are connected, you are ready to chain operations together and access their results:
lk.createExampleGraph().sql('select count(*) from vertices').df()
| count(1) | |
|---|---|
| 0 | 4.0 |
Creating boxes
You can use the LynxKite object to create boxes, such as in lk.createExampleGraph().
Inputs can be passed in as positional arguments and parameters as keyword arguments.
The easiest way to figure out the parameterization of a box is to set it up on the UI and then
click on the </> button to see the autogenerated Python code.
In a notebook or other IDE you can also rely on autocompletion.
The outputs of a Box object can be accessed by indexing it with the output name.
# Verbose example for illustration:
box1 = lk.createVertices(size=10)
state1 = box1['graph']  # Gets the output called "graph".
box2 = lk.createRandomEdges(state1, degree=3, seed=1)
graph = box2['graph']
Since many operations take a single input and produce a single output, there is a more concise API for them.
If a box has a single output, the box can be treated as if it were a State. If a box takes a single input, it is available as a method of States.
# Equivalently to the previous example:
graph = lk.createVertices(size=10).createRandomEdges(degree=3, seed=1)
Working with graphs and tables
In LynxKite we have workspaces which can contain non-linear workflows. These workflows are made of boxes and connections, and the boxes can have outputs of different kinds. One of the possible output kinds is a graph. Another output kind is a table which can be used in SQL queries. A table typically is an output of an import box or an SQL box, but there are other operations which output tables. In the background, tables are stored as Parquet files.
During development and debugging, the df() method on tables is the best way to look at your data.
It returns a Pandas DataFrame.
graph.computePageRank(damping=0.85, iterations=5, name='page_rank').sql('select * from vertices').df()
| id | ordinal | page_rank | |
|---|---|---|---|
| 0 | -8.292973e+18 | 6.0 | 1.186692 |
| 1 | -7.423979e+18 | 8.0 | 1.555379 |
| 2 | -7.261649e+18 | 3.0 | 0.661463 |
| 3 | -6.688468e+18 | 4.0 | 0.705636 |
| 4 | -4.962768e+18 | 0.0 | 0.460090 |
| 5 | -4.029975e+18 | 9.0 | 0.541939 |
| 6 | -3.109365e+18 | 1.0 | 0.948117 |
| 7 | 2.158391e+18 | 7.0 | 1.341214 |
| 8 | 4.437114e+18 | 2.0 | 0.765146 |
| 9 | 5.700977e+18 | 5.0 | 1.834324 |
There is also an API for directly accessing graph and table data:
# Example: accessing graph data

graph = lk.createExampleGraph().aggregateVertexAttributeGlobally(aggregate_income='average').get_graph()
graph_attributes = {s.title: lk.get_graph_attribute(s.id) for s in graph.graphAttributes}
print(graph_attributes['income_average'].double)
1500.0
# Example: accessing table data

table = lk.createExampleGraph().sql('select name, age, income from vertices').get_table_data()
print('Schema: ', [(field.name, field.dataType) for field in table.header])
print('Rows: ', [[field.string for field in row] for row in table.data])
Schema:  [('name', 'String'), ('age', 'Double'), ('income', 'Double')]
Rows:  [['Adam', '20.3', '1000'], ['Eve', '18.2', 'null'], ['Bob', '50.3', '2000'], ['Isolated Joe', '2', 'null']]
Import
Import boxes are special, because they bring data from outside the LynxKite world into LynxKite, and the result depends on the time of running the import. On the UI there is a “Run import” button to start the actual import.
The Python API can run the import boxes automatically. (Meaning we not only build the box but also run the import when the box is created.)
To distinguish between building an import box and running the import, the API has two versions of the import operations.
lk.importXYZcalls only return the boxes, which can be put into a workflow. (In some special cases it might make sense to add an import box to a workflow without running the import. In this case the Table GUID parameter has to be set manually by the caller as a parameter. But normally no-one should use this form.)lk.importXYZNowcalls also run the import. This is the typical case in an interactive workflow (e.g. when working in a notebook) and also in automation (using input recipes). In this case the Table GUID is set automatically.
In imports and exports, the location of the files are defined using prefixed paths . See the official documentation of LynxKite to learn more about prefixed paths.
# Example: importing a CSV file

csv_path = lk.upload('name,age\nAdam,20.3\nBob,50.3\nEve,18.2\nIsolated Joe,2')
lk.importCSVNow(filename=csv_path).df()
| name | age | |
|---|---|---|
| 0 | Adam | 20.3 |
| 1 | Bob | 50.3 |
| 2 | Eve | 18.2 |
| 3 | Isolated Joe | 2 |
# Example: simple non-linear workspace

# Input files
people_path = lk.upload('name,sex\nAdam,M\nEve,F\nSarah,F')
connections_path = lk.upload('src,dst\nAdam,Eve\nAdam,Sarah')

# Two branches of the workspace
people = lk.importCSVNow(filename=people_path).useTableAsVertices()
connections = lk.importCSVNow(filename=connections_path)

# The order of the inputs is fixed, so we don't have to name them in the API
result = lk.useTableAsEdges(people, connections, attr='name', src='src', dst='dst').computePageRank()
result.sql('select * from vertices').df()[['name','page_rank']]
| name | page_rank | |
|---|---|---|
| 0 | Adam | 0.778818 |
| 1 | Eve | 1.110591 |
| 2 | Sarah | 1.110591 |
The import methods which run the import automatically are:
importCSVNow,importJSONNow,importParquetNow,importJDBCNow,importFromHiveNow,importORCNow,importNeo4jNow
Export
Export boxes are also special, because on the UI, we can trigger the actual export with a “Run export” button, displayed on the output state of the export box. In the Python API we can trigger export boxes automatically.
To distinguish between building an export box and triggering the export, the API has two versions of the export operations.
lk.exportXYZcalls only return the boxes, which can be put into a workflow and these boxes can be triggered later to perform the export operation, usingexportXYZ().trigger().lk.exportXYZNowcalls also trigger the export operations, so are equivalent withexportXYZ().trigger().
The auto-triggered export methods are:
exportToCSVNow,exportToJSONNow,exportToParquetNow,exportToJDBCNow,exportToORCNow
# Example: exporting a table to parquet

export_path = 'DATA$/path/to/table'

# If this notebook runs locally, and this file has been saved earlier, we should delete it.
local_name = lk.get_prefixed_path(export_path).resolved.replace('file:', '')
import subprocess
subprocess.check_call(['rm', '-rf', local_name])

lk.createVertices().sql('select * from vertices').exportToParquetNow(path=export_path)
<lynx.kite.SingleOutputAtomicBox at 0x7efd4d6bbdd8>
Snapshots
The output of a box can be saved as a snapshot. Snapshot locations are specified as LynxKite paths. A saved snapshot can be loaded to another workflow to use as input. The path of a snapshot is a path in the LynxKite directory tree, so it makes sense only “inside” the LynxKite world.
To save a snapshot, we can
- either use
state.save_snapshot(path) - or add a
saveToSnapshotbox to the workflow, and trigger it. (We’ll explain triggering later.)
To use saved snapshots, we can load them by
- adding an
importSnapshotbox to the workflow, - or using
lk.importUnionOfTableSnapshotsto load a union of table snapshots.
The importUnionOfTableSnapshots box uses a list of snapshot paths as parameter and assumes
(and checks) whether all the snapshots have the same schema. If all the schemas are the same,
it imports the union of the tables.
# Example of saving and loading a snapshot

lk.createExampleGraph().sql('select avg(income) as avg_income from vertices').save_snapshot('tests/snapshots/avg')
lk.importSnapshot(path='tests/snapshots/avg').df()
| avg_income | |
|---|---|
| 0 | 1500.0 |
Forcing computation
The workflow building is lazy in the sense that when we add a box to a workflow it only means that we just defined a step in our workflow. The computation only runs when we access some output of the workflow (e.g. the value of a graph attribute or data in a table).
Sometimes we want to trigger all the computation in a workflow segment without accessing specific entities. We may want to do this in an automation project for example, if we need to know the execution time of parts of a complex workflow.
There are LynxKite boxes which are triggerable. When we trigger a
triggerable box, all of the inputs of this box will be computed.
The following boxes are triggerable:
Save to snapshot, Compute inputs, exportToCSV,
exportToJSON, exportToParquet, exportToJDBC, exportToORC.
Triggering a box
# Example: triggering a box

eg = lk.createExampleGraph()
eg.sql('select name, income from vertices').saveToSnapshot(path='names_and_income_snapshot').trigger()
Computing a state
If we need to compute a state (typically a graph or a table)
for performance testing, we can use the compute() method of the State class.
It connects the box of the state with a computeInputs box and triggers the
computation. This is a blocking call, so it can be used in benchmarks.
# Example: computing a state

lk.createVertices(size=20).createRandomEdges().computePageRank().compute()
Using SQL on graphs and tables
We can run SQL queries on graphs and tables.
When we run SQL on a table, we can reference the table in the query with the name
of the input plug, to which the input tables is connected. If an SQL box has one input,
its input is called input. If an SQL box has more than one input, these
are called one, two, three, …
The maximum number of allowed inputs of an SQL box is ten.
# Example: SQL on one input table

path = lk.upload('a,b\n1,2\n3,4\n5,6')
lk.importCSVNow(filename=path).sql1(sql='select a+b as c from input').df()
| c | |
|---|---|
| 0 | 3.0 |
| 1 | 7.0 |
| 2 | 11.0 |
# Example: SQL on two input tables

calls_path = lk.upload('id,calls\n1,2\n2,4\n3,6')
names_path = lk.upload('id,name\n1,Jano\n2,Hanna\n3,Andras')
calls = lk.importCSVNow(filename=calls_path)
names = lk.importCSVNow(filename=names_path)
lk.sql2(calls, names, sql='select name, calls from one inner join two on one.id = two.id').df()
| name | calls | |
|---|---|---|
| 0 | Jano | 2 |
| 1 | Hanna | 4 |
| 2 | Andras | 6 |
SQL shorthand notation
The recommended way to use SQL is through the simpler sql() methods on LynxKite and State objects.
This method automatically uses the right SQL box variant based on the
number of its inputs. It also makes it easy to refer to multiple input tables via meaningful names.
# Example: SQL shorthand notation

path = lk.upload('id,calls\n1,2\n2,4\n3,6')
table = lk.importCSVNow(filename=path)

# With a single input:
print(table.sql('select calls from input').df())

# Multiple inputs with meaningful names:
print(lk.sql('select count(*) as cnt from t1 cross join t2', t1=table, t2=table).df())
  calls
0     2
1     4
2     6
   cnt
0  9.0
SQL queries on graphs
The graph states have four tables by default: vertices, edges (includes vertex data), edge_attributes (no vertex data), graph_attributes. If a project has segmentations, we can also access segmentation_name.vertices type tables.
# Example: accessing tables of a graph in SQL

eg = lk.createExampleGraph()
print(eg.sql('select * from vertices').df())
print(eg.sql('select * from edges').df())
print(eg.sql('select * from edge_attributes').df())
    age  gender   id  income                   location          name
0  20.3    Male  0.0  1000.0       (40.71448,-74.00598)          Adam
1  18.2  Female  1.0     NaN    (47.5269674,19.0323968)           Eve
2  50.3    Male  2.0  2000.0      (1.352083,103.819836)           Bob
3   2.0    Male  3.0     NaN  (-33.8674869,151.2069902)  Isolated Joe
   dst_age dst_gender  dst_id  dst_income             dst_location dst_name  \
0     18.2     Female     1.0         NaN  (47.5269674,19.0323968)      Eve
1     20.3       Male     0.0      1000.0     (40.71448,-74.00598)     Adam
2     20.3       Male     0.0      1000.0     (40.71448,-74.00598)     Adam
3     18.2     Female     1.0         NaN  (47.5269674,19.0323968)      Eve

      edge_comment  edge_weight  src_age src_gender  src_id  src_income  \
0   Adam loves Eve          1.0     20.3       Male     0.0      1000.0
1   Eve loves Adam          2.0     18.2     Female     1.0         NaN
2  Bob envies Adam          3.0     50.3       Male     2.0      2000.0
3    Bob loves Eve          4.0     50.3       Male     2.0      2000.0

              src_location src_name
0     (40.71448,-74.00598)     Adam
1  (47.5269674,19.0323968)      Eve
2    (1.352083,103.819836)      Bob
3    (1.352083,103.819836)      Bob
           comment  weight
0   Adam loves Eve     1.0
1   Eve loves Adam     2.0
2  Bob envies Adam     3.0
3    Bob loves Eve     4.0
When a table name contains dots it must be quoted with backticks:
# Example: accessing tables of graphs in multi-input SQL box

eg = lk.createExampleGraph()
lk.sql('select * from `one.vertices` cross join `two.edge_attributes`', eg, eg).df()
| age | gender | id | income | location | name | comment | weight | |
|---|---|---|---|---|---|---|---|---|
| 0 | 20.3 | Male | 0.0 | 1000.0 | (40.71448,-74.00598) | Adam | Adam loves Eve | 1.0 |
| 1 | 20.3 | Male | 0.0 | 1000.0 | (40.71448,-74.00598) | Adam | Eve loves Adam | 2.0 |
| 2 | 20.3 | Male | 0.0 | 1000.0 | (40.71448,-74.00598) | Adam | Bob envies Adam | 3.0 |
| 3 | 20.3 | Male | 0.0 | 1000.0 | (40.71448,-74.00598) | Adam | Bob loves Eve | 4.0 |
| 4 | 18.2 | Female | 1.0 | NaN | (47.5269674,19.0323968) | Eve | Adam loves Eve | 1.0 |
| 5 | 18.2 | Female | 1.0 | NaN | (47.5269674,19.0323968) | Eve | Eve loves Adam | 2.0 |
| 6 | 18.2 | Female | 1.0 | NaN | (47.5269674,19.0323968) | Eve | Bob envies Adam | 3.0 |
| 7 | 18.2 | Female | 1.0 | NaN | (47.5269674,19.0323968) | Eve | Bob loves Eve | 4.0 |
| 8 | 50.3 | Male | 2.0 | 2000.0 | (1.352083,103.819836) | Bob | Adam loves Eve | 1.0 |
| 9 | 50.3 | Male | 2.0 | 2000.0 | (1.352083,103.819836) | Bob | Eve loves Adam | 2.0 |
| 10 | 50.3 | Male | 2.0 | 2000.0 | (1.352083,103.819836) | Bob | Bob envies Adam | 3.0 |
| 11 | 50.3 | Male | 2.0 | 2000.0 | (1.352083,103.819836) | Bob | Bob loves Eve | 4.0 |
| 12 | 2.0 | Male | 3.0 | NaN | (-33.8674869,151.2069902) | Isolated Joe | Adam loves Eve | 1.0 |
| 13 | 2.0 | Male | 3.0 | NaN | (-33.8674869,151.2069902) | Isolated Joe | Eve loves Adam | 2.0 |
| 14 | 2.0 | Male | 3.0 | NaN | (-33.8674869,151.2069902) | Isolated Joe | Bob envies Adam | 3.0 |
| 15 | 2.0 | Male | 3.0 | NaN | (-33.8674869,151.2069902) | Isolated Joe | Bob loves Eve | 4.0 |
If a graph has graph attributes, we can also query the value of those. The result is a table with one row, the columns are the graph attributes of the graph.
# Example: query the graph attributes of a graph

lk.createExampleGraph().aggregateVertexAttributeGlobally(aggregate_age='average').sql('select * from graph_attributes').df()
| !edge_count | !vertex_count | age_average | greeting | |
|---|---|---|---|---|
| 0 | 4.0 | 4.0 | 22.7 | Hello world! 😀 |
Saving a workspace
We saw that we can build linear parts of a complex workspace by chaining.
It is important to understand, that it’s not required to have a Workspace
object for adding a box. Basically, the API just adds boxes in “vacuum”
and connected boxes are implicitly in a “must be on the same workspace”
relation. Then the actual workspace is created by the Workspace
constructor or by the @workspace decorator (see later).
This also means that workspace parameters are not available at workspace building time.
To create a Workspace object, we have to give a name to the
workspace and have to specify the terminal boxes of the workspace.
The constructor explores all the boxes which are connected (directly or indirectly)
to the terminal boxes, and builds the complete workspace from these boxes.
A workspace object ws can be saved with ws.save('path/to/folder').
This method is recursive, it also saves all
the custom boxes, required to run the workspace. See the next section
on how to create custom boxes with the API.
To run a workspace, we don’t have to save it, but we have to save all the workspaces which are referred by custom boxes on the workspace.
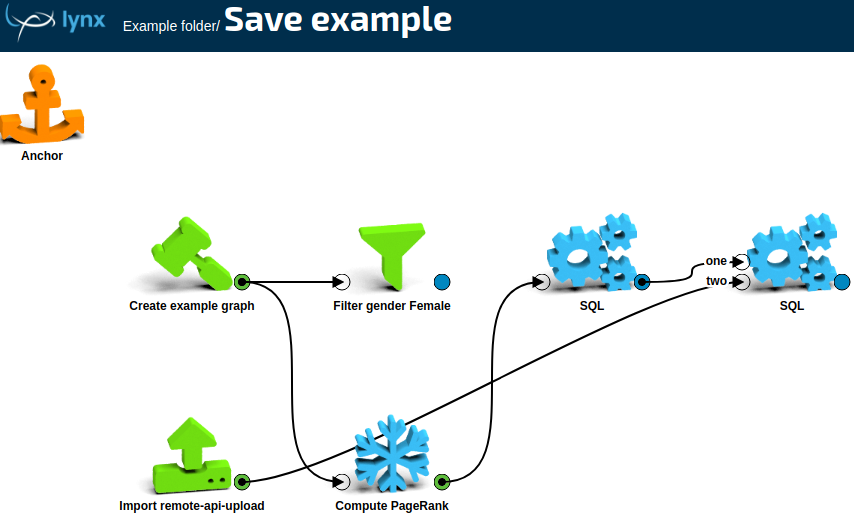
# Example: creating and saving a workspace

eg = lk.createExampleGraph()
pr = eg.computePageRank().sql('select name, page_rank from vertices')
names_path = lk.upload('name\nEve\nBob')
names = lk.importCSVNow(filename=names_path)
result1 = lk.sql('select * from one inner join two on one.name = two.name', pr, names)
result2 = eg.filterByAttributes(filterva_gender='Female')
# result1 and result2 are the terminal boxes (they are also states)
ws = lynx.kite.Workspace(name='Save example', terminal_boxes=[result1, result2])

# To save a workspace, we have to pass a folder to save().
# The workspace can refer to other workspaces, which will also be
# saved under this folder.
ws.save('Example folder')
'Example folder/Save example'
The saved workspace on the LynxKite UI:
The method ws.save returns the absolute path of the saved workspace,
because the name of the workspace can be auto-generated
in some cases.
Custom boxes
In LynxKite we can use one workspace from another as a custom box. This makes it easy to organize our workspaces meaningfully and re-use logical components.
The same can be achieved in Python simply by using functions.
If you use the LynxKite UI to look at the resulting workspaces, though, they will not have custom boxes. They will be huge sprawling networks of primitive boxes.
You can use the @subworkspace decorator from the LynxKite Python API to mark a function as the
equivalent of a custom box. This way the resulting workspaces will be easy to navigate on the UI.
# Example: custom box that outputs the top vertices by PageRank

@lynx.kite.subworkspace
def top_pr(graph, n):
    return graph.computePageRank().sql(f'select * from vertices order by page_rank desc limit {n}')

eg = lk.createExampleGraph()
random_graph = lk.createVertices(size=20).createRandomEdges()

print(top_pr(eg, 2).df())
print(top_pr(random_graph, 3).df())
    age  gender   id  income                 location  name  page_rank
0  20.3    Male  0.0  1000.0     (40.71448,-74.00598)  Adam   1.809173
1  18.2  Female  1.0     NaN  (47.5269674,19.0323968)   Eve   1.809173
             id  ordinal  page_rank
0  3.246199e+18     19.0   1.953536
1 -3.169240e+17     15.0   1.894334
2 -6.688468e+18      4.0   1.818231
Workspace parameters
While not generally useful outside of automation projects, the API also supports the use of workspace parameters with @subworkspace.
These parameters are then visible in the UI and they are substituted in parametric parameters via Scala string interpolation.
# Example: workspace parameters for custom boxes

@lynx.kite.ws_param('p1')
@lynx.kite.ws_param('p2', default='x', description='The second column.')
@lynx.kite.subworkspace
def my_func(input1):
    return input1.sql1(sql=lynx.kite.pp('select $p1, $p2 from vertices'))

my_func(lk.createExampleGraph(), p1='age', p2='name').df()
| age | name | |
|---|---|---|
| 0 | 20.3 | Adam |
| 1 | 18.2 | Eve |
| 2 | 50.3 | Bob |
| 3 | 2.0 | Isolated Joe |
Custom boxes with multiple outputs
Custom boxes can return a dictionary instead of a single state. The keys of the dictionary will be the names of the outputs of the custom box.
# Example: splitting a table into a "train" and a "test" table, using a ratio parameter.

data_path = lk.upload('''
SERVICE_ID,RESULT,TOTAL_DURATION,VOD_CNT,ARPU
12139086,1,2638561,2,4
12067945,1,274928,5,4
15144654,0,2467013,5,4
11824255,0,404214,1,4
12196303,0,854772,13,4
16011876,0,203825,3,1
15397252,0,108090,2,4
12623730,0,1586167,4,4
12338397,1,497658,1,4
16044877,0,85442,14,2''')
original_table = lk.importCSVNow(filename=data_path)

@lynx.kite.subworkspace
def numrows(table):
    return table.sql('select count(*) as cnt from input')

@lynx.kite.subworkspace
def split_table(table, ratio):
    # We use the ``rand()`` function of Spark SQL here.
    extended_table = table.deriveColumn(name='filter_col', value='rand()')
    train_set = extended_table.sql(f'select * from input where filter_col <= {ratio}')
    test_set = extended_table.sql(f'select * from input where filter_col > {ratio}')
    return dict(train=train_set, test=test_set)

split = split_table(original_table, 0.6)
print(numrows(split['train']).df())
print(numrows(split['test']).df())
print(split['test'].df())
   cnt
0  6.0
   cnt
0  4.0
  SERVICE_ID RESULT TOTAL_DURATION VOD_CNT ARPU  filter_col
0   12139086      1        2638561       2    4    0.907135
1   16011876      0         203825       3    1    0.968432
2   15397252      0         108090       2    4    0.946777
3   16044877      0          85442      14    2    0.914008
External computation
You can also make custom boxes that execute arbitrary Python code.
Just mark the function with the @external decorator.
In this case an External computation box is added to the workspace. First, LynxKite has to compute and write out the inputs of this box. Then your function is called in the Python process. It reads the data and writes out the results. LynxKite then loads back the results into a LynxKite state.
You need to manually trigger this blocking computation with the trigger() method.
# Example: external computation.

import numpy as np

@lynx.kite.external
def titled_names(table, default):
    df = table.pandas()
    df['gender'] = df.gender.fillna(default)
    df['titled'] = np.where(df.gender == 'Female', 'Ms ' + df.name, 'Mr ' + df.name)
    return df

t = titled_names(lk.createExampleGraph().sql('select name, gender from vertices'), 'Female')
t.trigger() # Causes the function to run.
print(t.df())
           name  gender           titled  __index_level_0__
0          Adam    Male          Mr Adam                0.0
1           Eve  Female           Ms Eve                1.0
2           Bob    Male           Mr Bob                2.0
3  Isolated Joe    Male  Mr Isolated Joe                3.0
For more details see the LynxKite Python API Reference.