Beautiful workspaces and wizards
It feels great to finish a challenging analytics task and see the fruits of your labor on your screen. But the work is not over yet! The next step is commonly one of:
- Automation. You built a model and want to run it every day. The LynxKite Python API tutorial is for you.
- Screenshot some charts and put them in a slide deck.
- Share a link to your Jupyter notebook or LynxKite workspace.
- Build a custom web application for other users.
This blog post is about the last two options. First, some tips for building LynxKite workspaces that are easy to understand. Then a quick guide to turning those workspaces into LynxKite wizards for end users. Wizards are not as flexible as entirely custom applications, but they get you much of that power with just a few clicks.
Tidy workspaces
Users who are not programmers generally don’t get a lot of use out of Jupyter notebooks. LynxKite workspaces are much more approachable. To make our workspaces as easy to read as possible we have found these tips useful:
- Shift-drag boxes to align them on a grid and your lines will be perfectly straight!
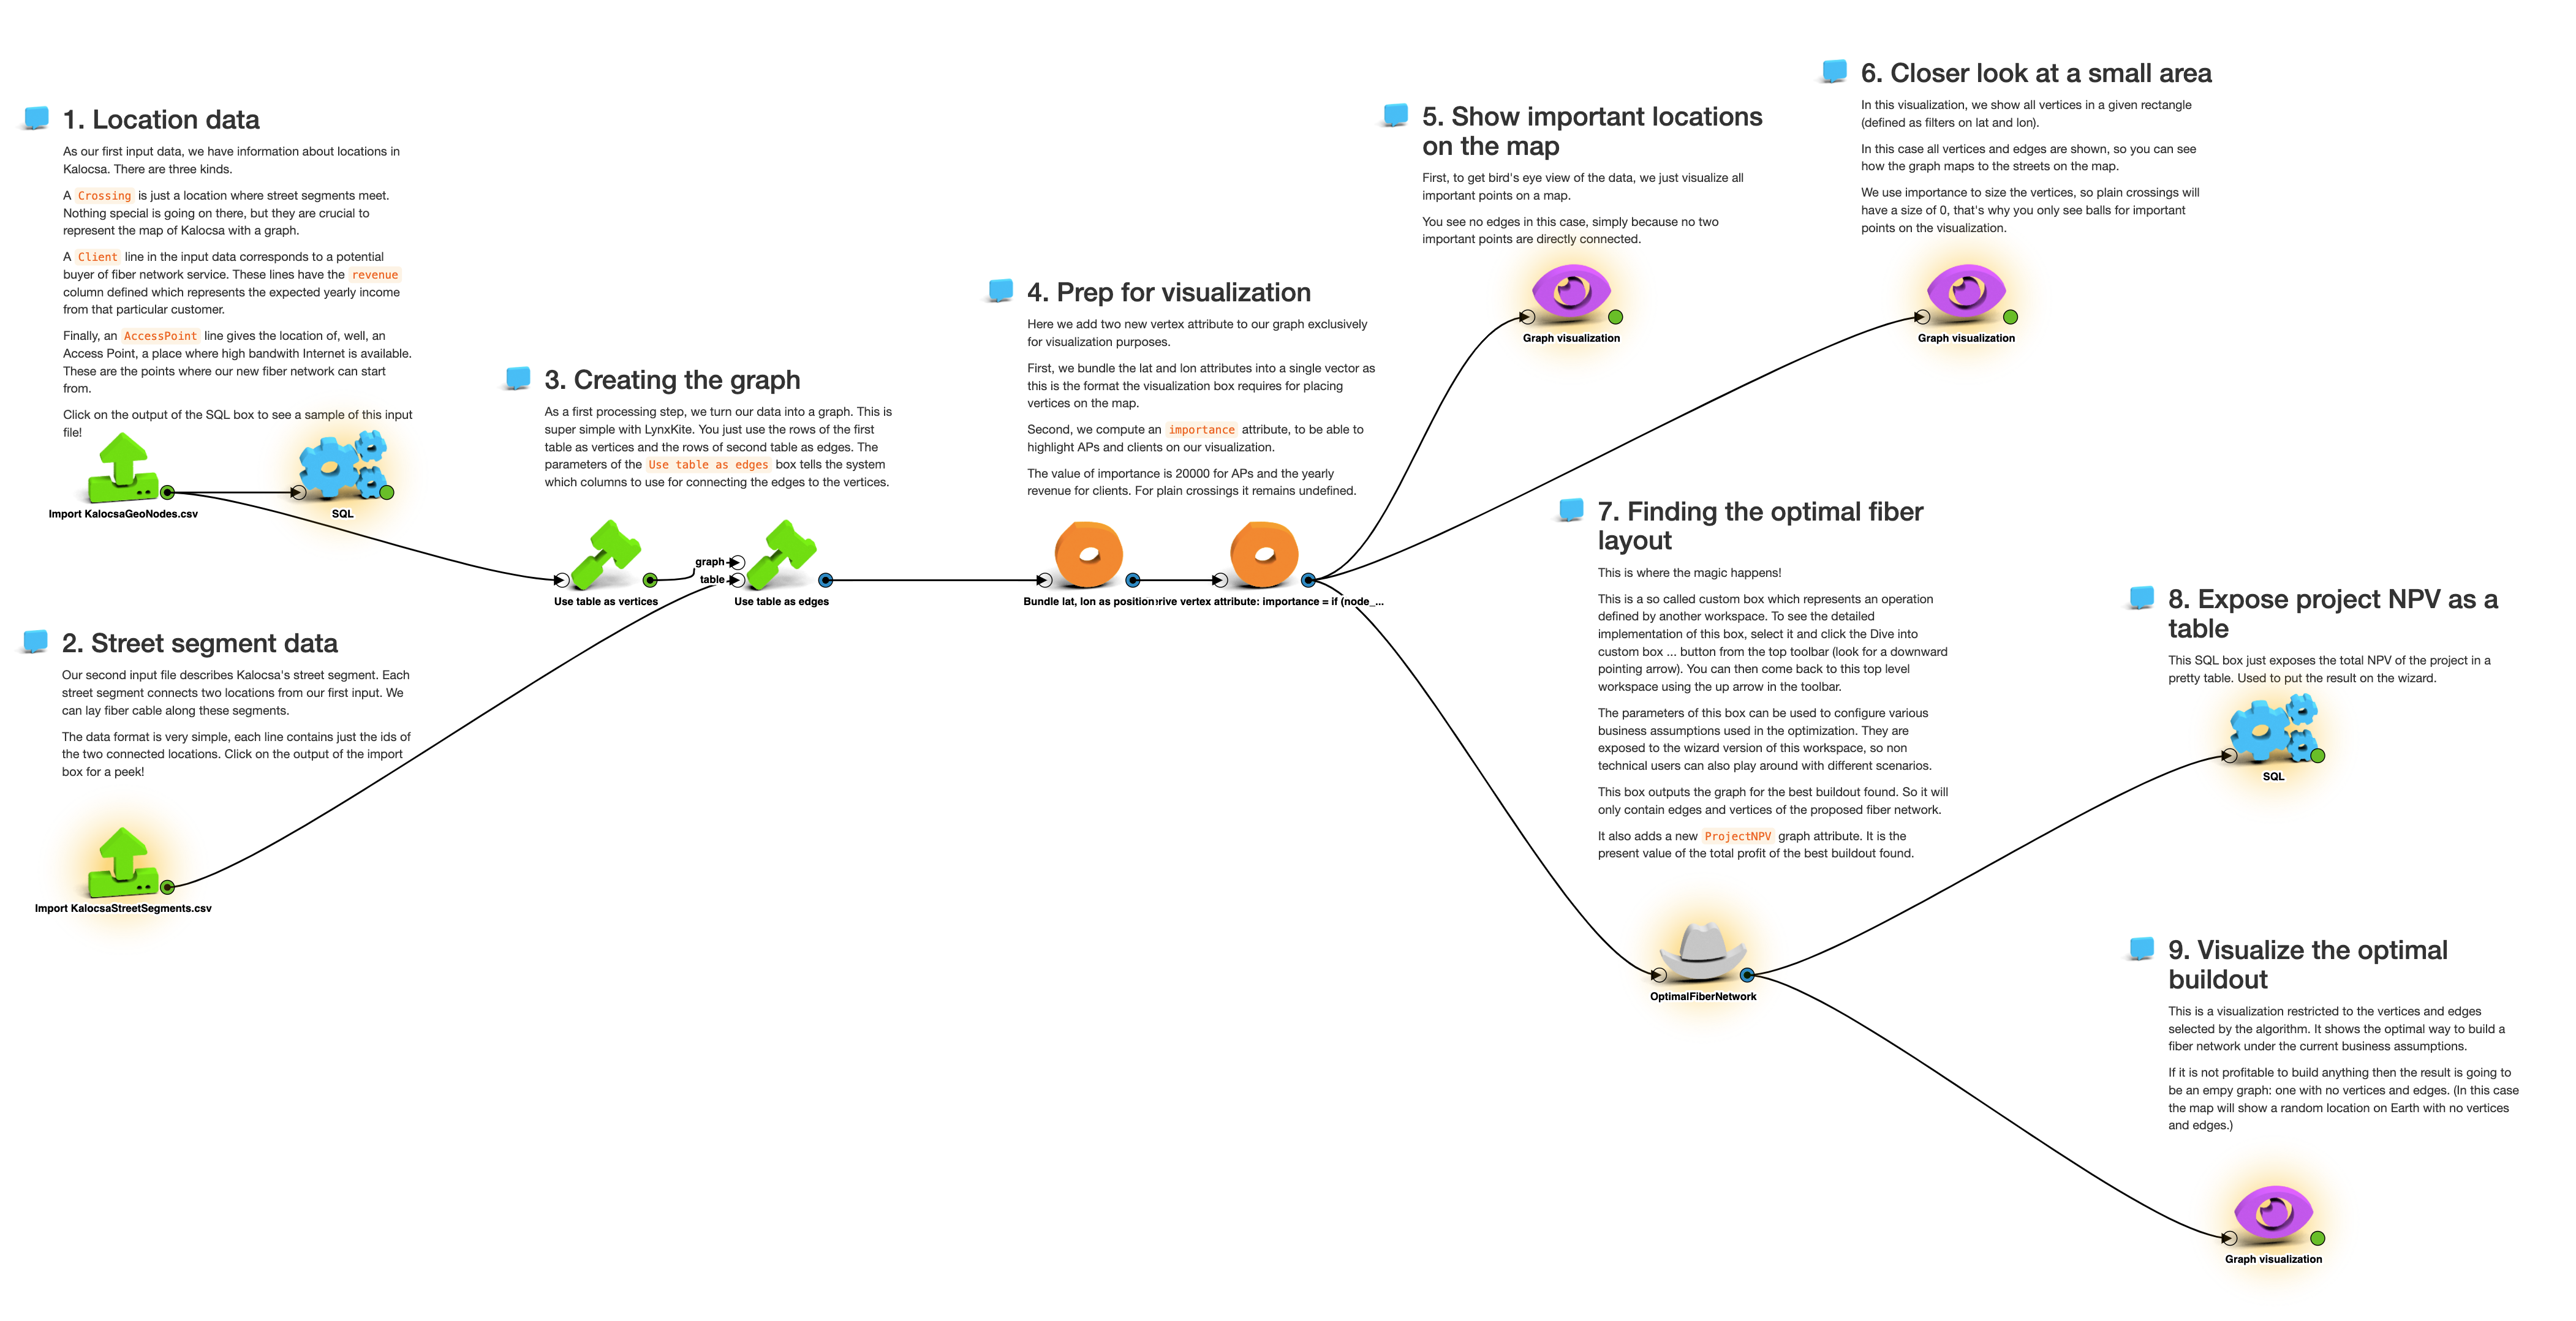
- Use comment boxes. Their parameter is Markdown. Spice up your workspace with bold headers and animated GIFs!
- A part of your workspace may be repeated. For example, you may import and process multiple files the same way before combining them. Turn the repeating steps into a custom box to avoid repetition.
- You may find yourself using the same value in the parameters of multiple boxes. For example, you may be interested in one date so you filter to that date in an SQL box, a vertex filter, and an edge filter. If you repeat the date three times, changing it will be boring and error-prone. Instead you can turn the boxes into a custom box that takes the date as a parameter.
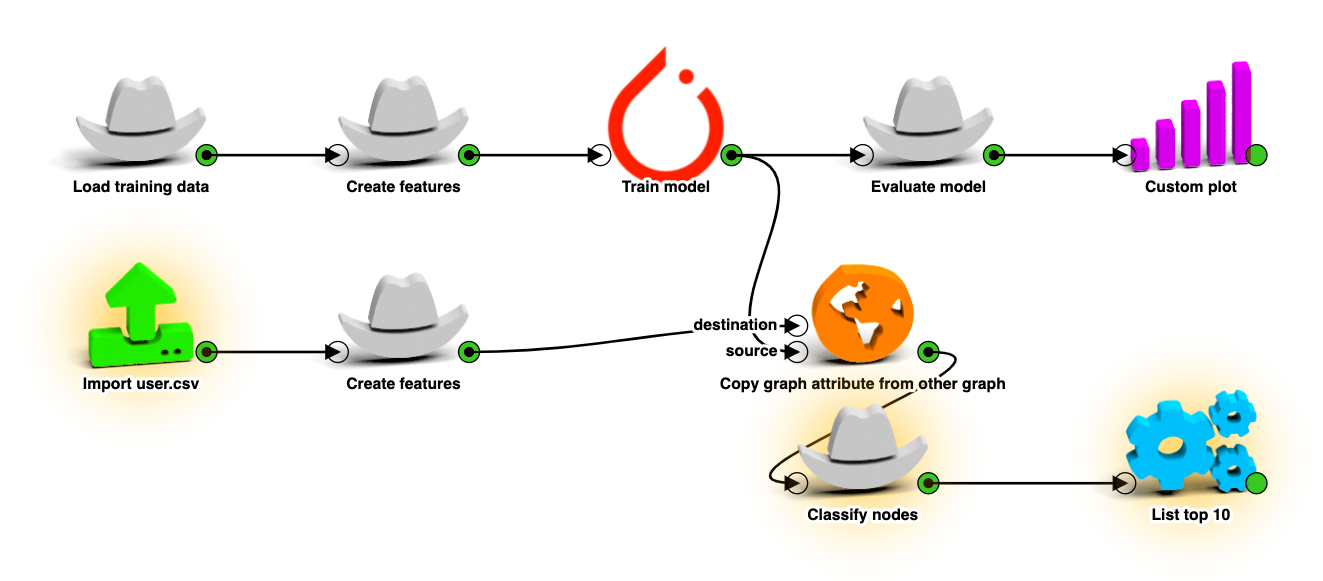
- Even in the absence of repetition, custom boxes help explain the high-level structure of your work. Seeing “Load dataset”, “Create features”, “Train model”, and “Evaluate model” custom boxes makes the purpose of each part of the pipeline clear.
- You can use custom icons for custom boxes. Just put the image URL in the Anchor box of your custom box.

Even so, the workspace will inevitably tell the story of how the analysis is done. That is what data scientists want to know. But end users just want the results.
Sharing your results
In the above example let’s say our model classifies the nodes of a graph. We trained it because we have business users that care about this classification. They want to use this model on their own data and see the nodes that get the most confidently positive labels.
In the workspace we import the new dataset, generate the same features, copy over the trained model, use it for scoring, then list the top 10.

We could hand this workspace to the end users and train them to open each of the highlighted boxes in order to upload their data, set some model parameters, and look at the top results. In practice we were not satisfied with this solution:
- The most important results are displayed in a tiny popup.
- It’s error prone. One wrong click and you’ve made a mess.
- Multiple users editing the same workspace will step on each other’s toes.
We designed LynxKite wizards to address these issues.
Enter wizards
LynxKite wizards are easy-to-use step-by-step workflows that end users can use without any LynxKite training.

To turn a workspace into a wizard just change “Wizard” to “yes” in the Anchor box. At that point it’s a wizard with zero steps. Now you can click the “Add to wizard” button on any popup and it’s added as the next step.
You can change the order of steps or further customize them in the Anchor box. See the LynxKite User Guide to learn all the details.
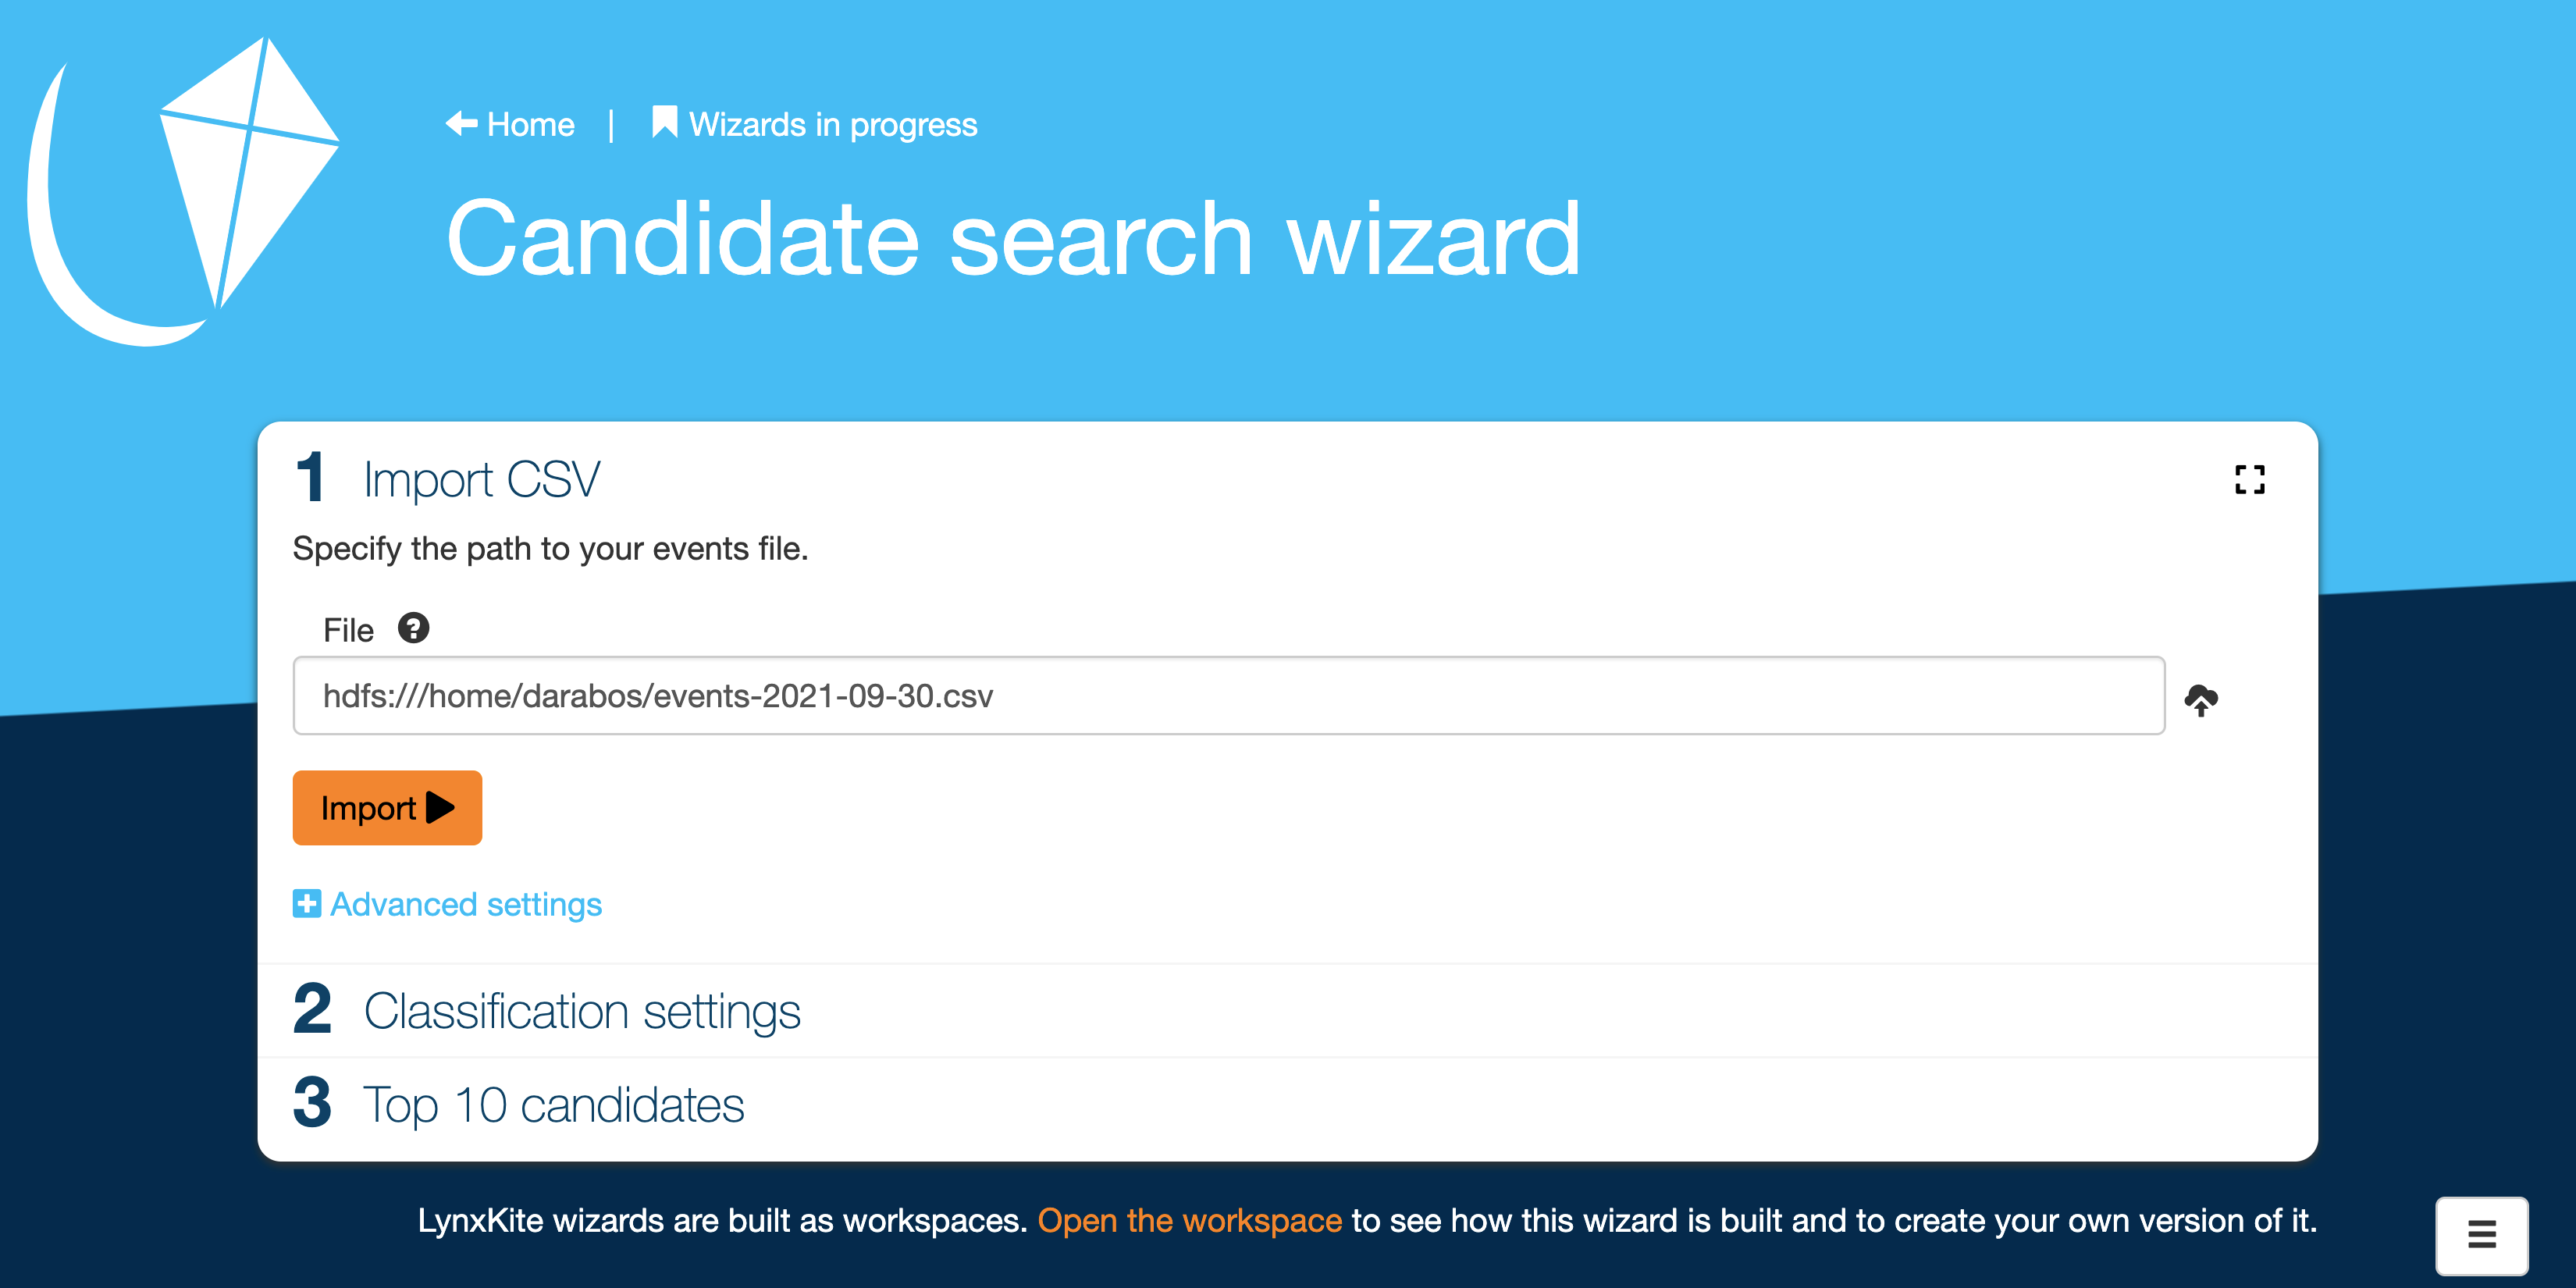
Now when a user clicks on the workspace in the LynxKite directory they see the wizard interface:

The steps that require the user’s attention are clearly ordered. Only one step is expanded at a time. We even have a full-screen mode for a 100% distraction-free experience. (It’s great for graph visualizations.)
Each step simply displays the contents of one of the popups that we added to the wizard. “Classification settings” in the screenshot would show the parameters of the “Classify nodes” custom box. When using custom boxes, you are completely in control of what parameters are presented to the user.
A wizard is amazingly easy to build, provides a lot of flexibility for its designer, and addresses the shortcomings of handing over whole workspaces to end users.
- The results are presented clearly without distractions.
- The user cannot change anything they are not meant to change.
- Each time a wizard is opened, a separate instance is created. Users will not interfere with each others’ work.
At the bottom of the wizard page is a link to the workspace view. This is a path for end users to become power users. At first they make small tweaks and before long they are creating new wizards themselves!
Example wizards
“Planning a fiber network” is my favorite. It lets the user focus on the business aspects of the problem. We can specify the key business parameters, such as unit cost and estimated revenue, which then serve as the basis of the optimization that happens behind the scenes. Thanks to LynxKite’s fast Steiner tree optimizer we can see the network layout change as soon as the business parameters are altered.
The workspace behind this wizard has detailed comments and is a good way to get started with processing geographic networks. Or for building wizards around the same!
If you’ve built any cool wizards, let us know on LinkedIn, Twitter, or lynxkite@lynxkite.com.
